
A catalog rate naturally catches the eye. It is a clean number; a working shift is not. The figure cannot anticipate the boards that arrive, crusher returns, or lost operating time. Bring those details into the PCB recycling plant capacity calculation, then challenge the result in a continuous run with the actual feed, net production hours, and slowest connected stage.

Sort a representative pallet before discussing rate. Bare copper-clad laminate is one job; populated computer, phone, and television boards are another. Rigid PCBs and flexible circuits add variation. Record each group's mass share, then follow the split through preparation, crushing, classification, and separation. This reveals PCB recycling plant capacity better than one combined weight.
Record each board's mass share and condition: whole, dismantled, or pre-cut. Note batteries, iron pieces, heat sinks, and similar attachments that affect preparation. Assemble the test lot in normal proportions, not from boards that are easiest to collect.
The MAXIM machinery PCB recycling plant capacity covers computer boards, mobile-phone boards, television boards, copper-clad laminates, PCBs, and FPCBs, and describes separation of mixed metals from nonmetallic material. This is a broad feed range, so name the material used in the test. A result from one controlled category cannot be assumed to be the PCB recycling plant capacity for a different mixture.
Set the feed rule before the run: maximum board size, pre-cut target, moisture condition, and treatment of batteries or prohibited items. Keep it fixed. A change at mid-run creates a separate case, whether or not the scale stops. Report each processed mass against the condition that applied.
Eight scheduled hours rarely mean eight feeding hours. Deduct cleaning, changeovers, start-up and shutdown checks, maintenance, and other planned pauses. Record unplanned stops and their causes separately. The remainder is the denominator: hours when boards could enter. Replace the allowance with plant records when they become available.
Now divide planned daily fresh-feed mass by net operating hours. The quotient is the fresh-feed rate the test must sustain—not evidence that the line has sustained it. For the agreed board mix, PCB recycling plant capacity cannot exceed the slowest verified stage.
| Capacity Input | What to Record | Calculation or Decision |
| Daily fresh feed | Kilograms per board category | Sum category mass for the daily target |
| Representative board mix | Percentage by mass for each category | Build the continuous-test lot from the same proportions |
| Scheduled production time | Shift hours per day | Start with the approved production schedule |
| Planned non-running time | Cleaning, changeover, checks, breaks, maintenance | Subtract from scheduled time to get net operating hours |
| Tested stage rates | Stable kg/h for each connected stage | Use the lowest verified rate as the line bottleneck |
| Recirculated material | Return mass divided by fresh-feed mass | Add internal load when checking crusher and classifier duty |
| Required tested rate | Daily fresh feed divided by net operating hours | Compare with the bottleneck rate under the same test conditions |
Use the worksheet again when the operating case changes. The normal mix, the most demanding credible mix, and a peak-day schedule each need their own PCB recycling plant capacity calculation. A shortfall then appears in relation to the tested bottleneck rather than as a vague capacity concern. PCB recycling production planning can compare an extra shift with preparation or equipment changes; any safety percentage still needs a named risk.
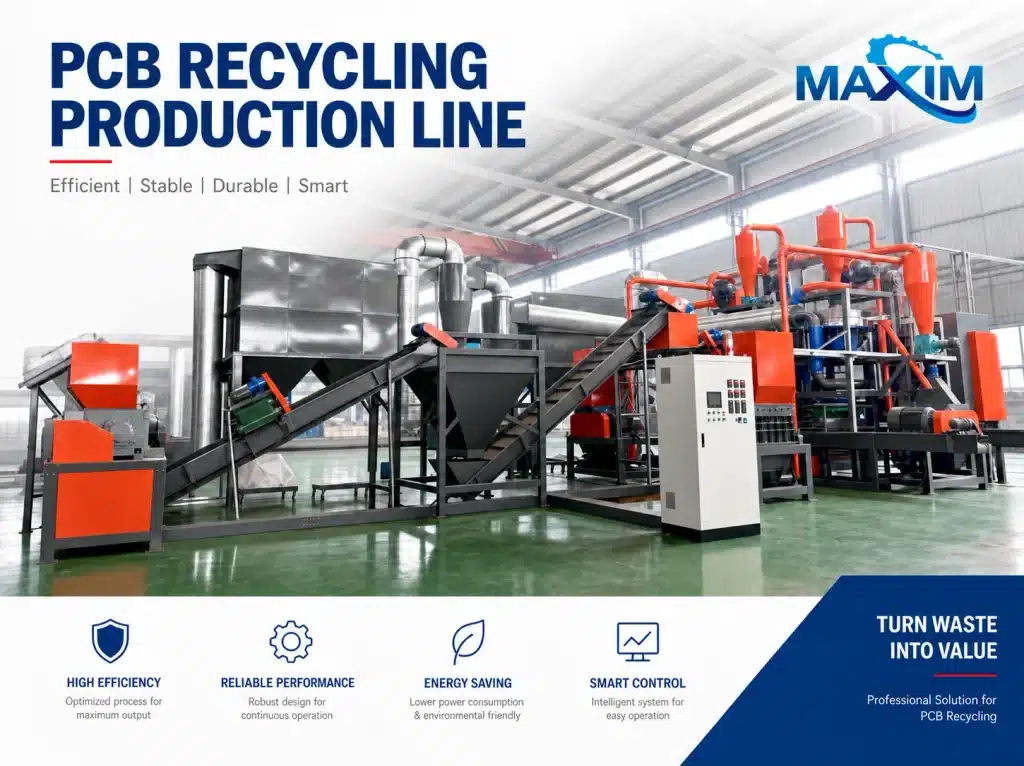
Follow one batch through the line. What leaves the crusher feeds the classifier, and its product goes on to separation. The stages therefore cannot have their ratings added together. Watch them run as one system and note the lowest stable rate. That rate, with all required stages online, is the working ceiling for PCB recycling plant capacity.
Measure inlet mass, stable run time, interruptions, and acceptable output in the same test window. A fast crusher may simply move the queue to a classifier, while separator adjustments consume time elsewhere. The existing PCB recycling process guide covers the wider sequence; the capacity question is where that connected sequence settles.
In the MAXIM machinery line, PLC-coordinated feeding is connected to recirculation, magnetic separation, air classification, dust collection, and electrostatic separation. Capacity lives in that interaction. For PCB recycling plant capacity, the useful evidence is therefore a stable continuous run on the declared feed—not motor power or a single-machine rate.
Fresh-feed weight misses the material travelling around the circuit again. Weigh this return; it also occupies the crusher, conveyors, and classifier. Return mass divided by fresh feed gives the return ratio. Estimate internal duty as fresh-feed rate multiplied by one plus that ratio.
A brief run can flatter the inlet rate while material accumulates between stages. Let queues and return flow settle before naming PCB recycling bottlenecks. Duration, return mass, stoppages, and unfinished work at shutdown show whether the rate held.
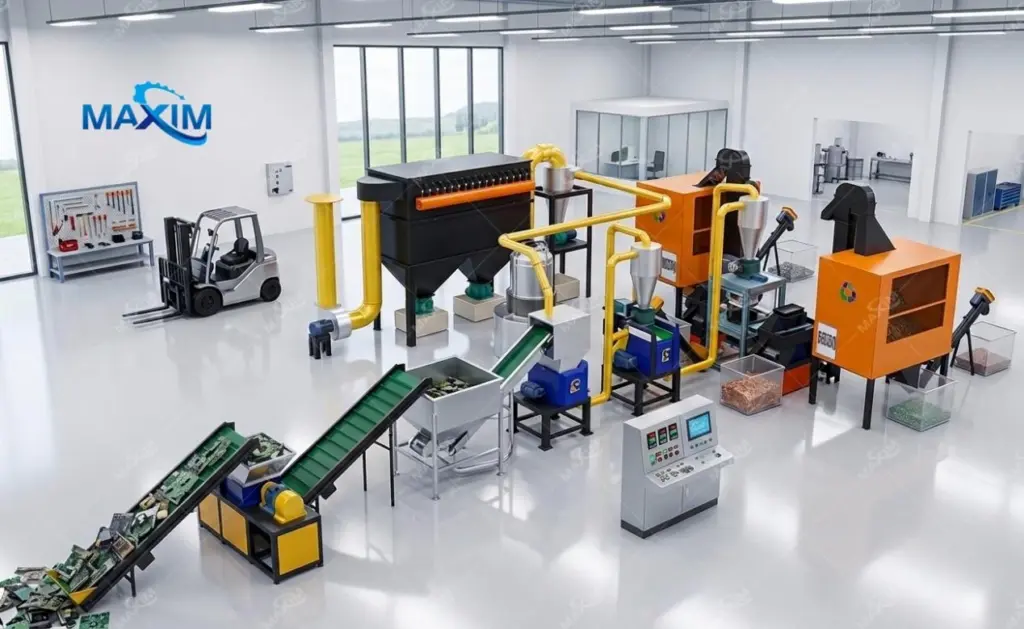
Could an absent engineer rebuild the case from the report? Include daily mass, board proportions, incoming size, preparation rules, net hours, required output condition, and samples. Also record duration, fresh-feed and return rates, the bottleneck, stops, and material still in process at shutdown.
A nominal range opens the discussion. Feed and site conditions finish it. MAXIM machinery develops customized layouts around required production capacity, material characteristics, and the installation site. Set our proposal beside the completed worksheet; isolated headline rates cannot define PCB recycling plant capacity.
Write the test boundary into the plan. The representative mix and all specified separation and dust-control stages belong inside it; material still circulating or waiting between stages does not count as finished. On that basis, circuit board processing capacity describes usable production rather than a momentary feeding peak.
If the worksheet comes up short, separate a time problem from a machine problem. More scheduled hours cannot cure a constrained separation stage. Changing preparation is another option, with consequences for labor and equipment.
When you contact MAXIM machinery, include the mix table, samples, and schedule. These give the technical team intended test conditions against which to discuss the proposed line.
A: Count only the hours available for feeding. Start with the scheduled shift and remove planned non-running time. Divide the day's fresh-feed target by the hours left, then place that required rate beside the lowest stable rate measured across the connected line for the same mix and preparation rules. Whichever figure is lower defines PCB recycling plant capacity for that operating case.
A: Board mix changes the work the line has to do. Bare, populated, rigid, and flexible boards may prepare, crush, recirculate, and separate differently. State each share by mass and recreate it in the test lot, with size and removal rules unchanged. Recheck PCB recycling machine throughput before applying the result to another mix.
A: Record daily mass by board category, mix percentages, incoming size, preparation rules, net operating hours, planned stops, stage rates, recirculated mass, test duration, and remaining work in process. Add the required output condition. Without it, PCB recycling line sizing quotes a rate without saying whether the material is usable.
A: The stage with the lowest stable rate is the bottleneck for the agreed material and operating conditions—not necessarily for every condition. A different mix, particle-size requirement, return flow, or adjustment frequency can move it. Measure the connected stages during one continuous run and review queues, stoppages, and recirculation before naming the active PCB recycling bottlenecks.
A: Put a representative sample through all required processing, separation, conveying, and dust-control stages for one agreed continuous period. Log fresh feed, return flow, stops, output, and unfinished material. The measured rate needs those conditions and its calculation boundary beside it; otherwise circuit board processing capacity cannot be evaluated. That keeps PCB recycling plant capacity tied to usable output.
A catalog rate naturally catches the eye. It is a clean number; a working shift is not. The figure cannot anticipate the boards that arrive, crusher returns, or lost operating time. Bring those details into the PCB recycling plant capacity calculation, then challenge the result in a continuous run with the actual feed, net production excerpt …
